Personal finance looks simple until the data becomes real.
Transactions arrive from multiple banks in different formats. Investments sit across brokers. Equity requires lot-level accounting. US investments introduce foreign exchange. Corporate actions change holdings. Tax treatment depends on transaction history.
This builds on an earlier blog I wrote about, where I explored how AI could help me automate aspects of personal finance and build dashboards. This time, I took the idea much further and built an end-to-end financial system, including an Investment Tracker covering the full investment lifecycle, a Finance Tracker, and two AI interfaces. I am now able to assess my fund position for the quarter/month in couple of hours.
I wanted to bring these pieces together in a system that could do more than track expenses or display a portfolio. So I built a local financial system with two applications:
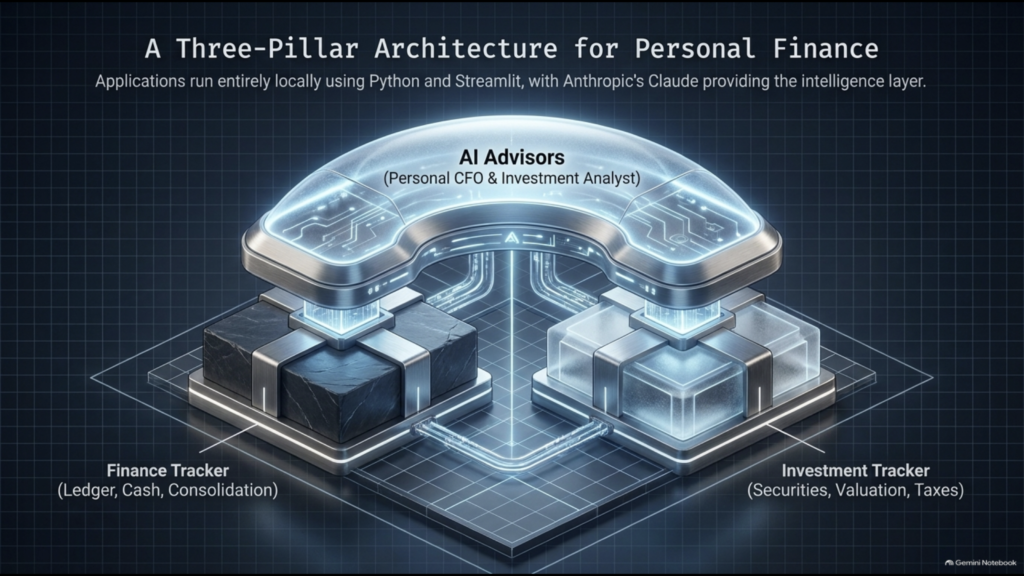
- Finance Tracker — converts bank and credit-card statements into a reconciled ledger and provides a consolidated view of cash, liquidity and financial position.
- Investment Tracker — maintains the securities record, including transactions, holdings, FIFO lots, valuation, multi-currency accounting and tax calculations.
- AI Layer – On top of these sits the AI layer with two advisors: a Personal CFO for overall financial review and an Investment Analyst for portfolio analysis.
The applications run locally using Python and Streamlit, with Claude providing the AI layer.
Finance Tracker: More Than an Expense Tracker
The Finance Tracker takes data from different financial institutions and converts it into a consistent transaction model.
It handles ingestion, normalisation, categorisation, duplicate detection, reconciliation and period controls, while bringing together spending, cash, fixed deposits and investments.
A key design principle is canonical calculation ownership: Calculations have one owner; every other layer reads the result.
The application therefore has dedicated areas for transaction management, reconciliation and period close, spending and cash-flow analysis, and a consolidated Fund Position.
The result is closer to a lightweight personal financial operating system than a conventional expense tracker.
Investment Tracker: Treating a Portfolio as a System
The Investment Tracker is the system of record for investments. It brings the trade book, holdings, valuation, realised gains and portfolio analysis into one place.
It supports multiple asset classes and handles:
- Equity lots and FIFO
- Broker-level positions
- Corporate actions
- Indian and US equities
- Historical USD/INR
- Realised and unrealised P&L
- XIRR and CAGR
- STCG/LTCG and tax harvesting
- Mutual funds and bonds
- Portfolio and benchmark analysis
Market data is sourced by asset class: Yahoo Finance (through yfinance) for Indian and US equities, ETFs and USD/INR; AMFI’s NAV API for mutual funds; and CoinGecko for crypto in rupees. Month-end price snapshots are committed so that a valuation can be reproduced for a defined date.
US investments also highlighted an important distinction: economic performance and tax reporting can require different FX treatment. The system therefore maintains separate FX policies for the two views while using the same calculation engine.
Defining the Rules
The hardest part of the project was not writing code. It was deciding what the code should mean.
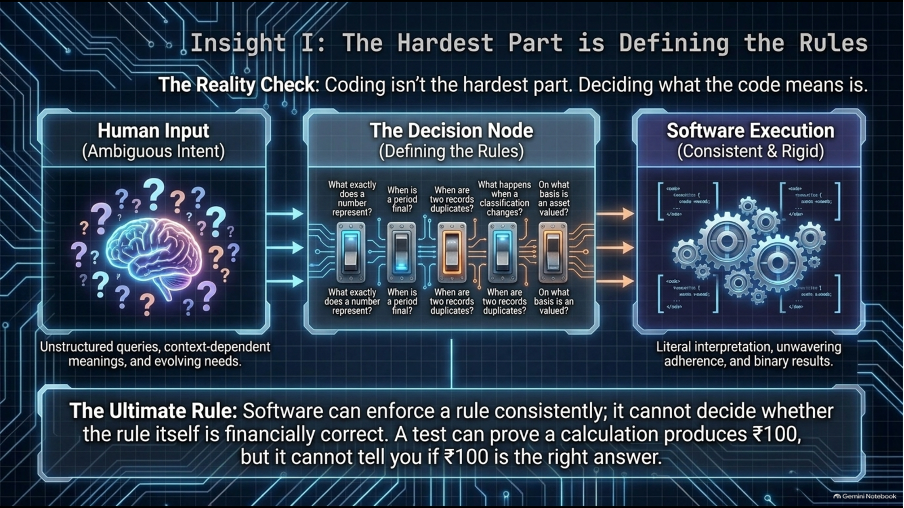
Before building, I had to answer questions such as:
- What exactly does a number represent?
- When is a period final?
- When are two records duplicates?
- What happens when a classification changes?
- What happens when a value is unavailable?
- On what basis is an asset valued?
Software can enforce a rule consistently; it cannot decide whether the rule itself is financially correct.
A test can prove that a calculation consistently produces ₹100. It cannot tell you whether ₹100 is the right answer.
Designing for Reliability
I added a separate review layer to challenge the application’s financial outputs. It includes financial-consistency controls, cross-screen tie-outs and adversarial tests designed to expose incorrect assumptions or calculation paths.
One of the most useful lessons came from an actual defect.
When a market price was unavailable, an early version used the investment’s cost basis as a fallback. Totals looked complete. Ratios looked plausible. Nothing crashed.
But the number was wrong.
A partial total can be more dangerous than a missing total because it looks complete.
Architecture
The architecture follows another simple principle: each kind of work should have one home.
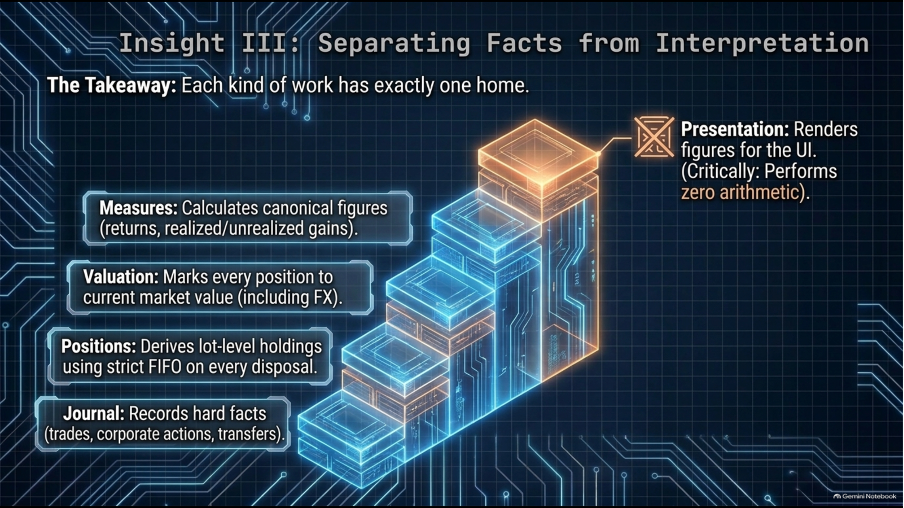
The Finance Tracker follows the same philosophy through its
Ledger – Financial state – Insight engine – AI advisor layers.
The presentation layer performs no financial arithmetic. The AI layer does not calculate portfolio numbers. This separation keeps the financial engine independent from the interface and from AI.
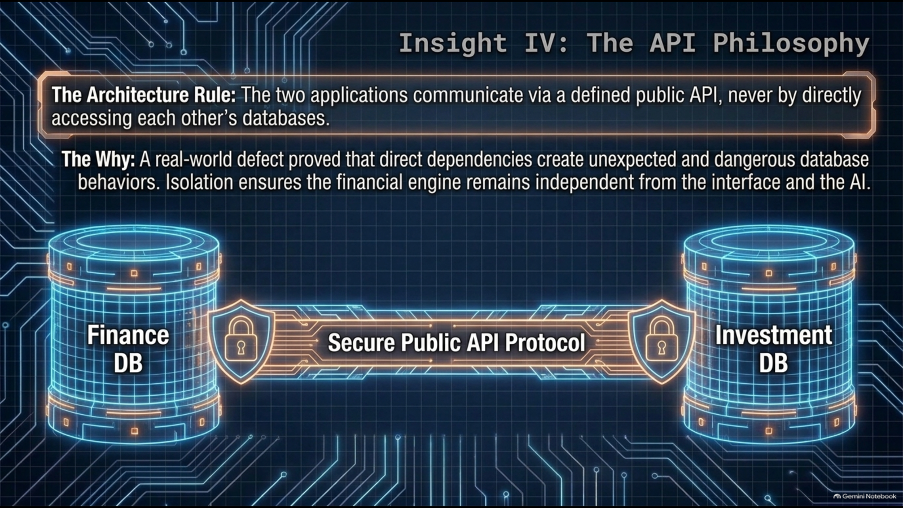
The two applications communicate through a defined public API rather than directly accessing each other’s databases.
Where AI Fits
Once the underlying systems were structured, AI was introduced as an intelligence and decision-support layer.
The governing principle is:
The application owns the numbers. AI interprets them.
Two AI experiences were built:
Ask Investment Analyst / Personal CFO: Chat bot
A conversational interface for asking questions and getting answers grounded in the application’s financial data, with external research where required.
Portfolio Review / Financial Review: Structured Report
predefined, structured reports that assess the portfolio or overall financial position across key areas and produce actionable recommendations. Reports can also be downloaded for review.
The Portfolio Review brings together the key dimensions of investment performance and decision-making. It covers:
- Portfolio overview — cost, market value, unrealised and realised P&L, returns, and currency/geography split.
- Performance vs. benchmark — Indian and US equity performance against Nifty 50 and S&P 500.
- Analyst view — external ratings and target prices for the Top 10 holdings, including potential upside/downside.
- Gainers and losers — the positions contributing most to current unrealised gains and losses.
- Disposal candidates — positions that may warrant trimming or exiting, with the reasoning and proposed approach.
- Buy/reallocation recommendations — where released capital could be redeployed, based on stated risk appetite.
- Realised P&L analysis — what past trading behaviour reveals about winners, losers, holding periods and sell discipline.
The Financial Review looks at the broader financial position rather than individual investments. It covers:
- Executive summary — net worth and the most important developments for the period.
- Financial position — cash, fixed deposits, investments and retirement assets.
- Cash flow and spending — income, expenses, savings rate and spending drivers.
- Liquidity — expense coverage, liquid assets and upcoming fixed-deposit maturities.
- Investment allocation — high-level allocation across equity, ETFs, bonds, mutual funds, crypto and gold.
- Key risks — concentration, liquidity, upcoming commitments and issues identified from the personal context.
- Prioritised recommendations — a focused action list bringing the analysis together.
Each application has its own persona.
- The Investment Analyst is framed as a senior investment analyst and is calibrated to a stated risk appetite.
- The Personal CFO is framed as a senior personal CFO and is calibrated to a free-text personal context, and hands any per-holding question back to the Analyst so the two never compete to answer the same question.
Both advisors run on Anthropic’s Claude API, with a selectable model tier (Opus 5 for quality, Sonnet 5 for standard work) and a selectable reasoning-effort level, so depth and cost can be matched to the question.
Engineering the AI, Not Just Prompting It
Building the AI layer involved more than writing prompts. Each advisor combines a defined persona, grounding rules and structured outputs. Every financial figure must come from the application’s data, and an unknown value is never treated as zero or cost.
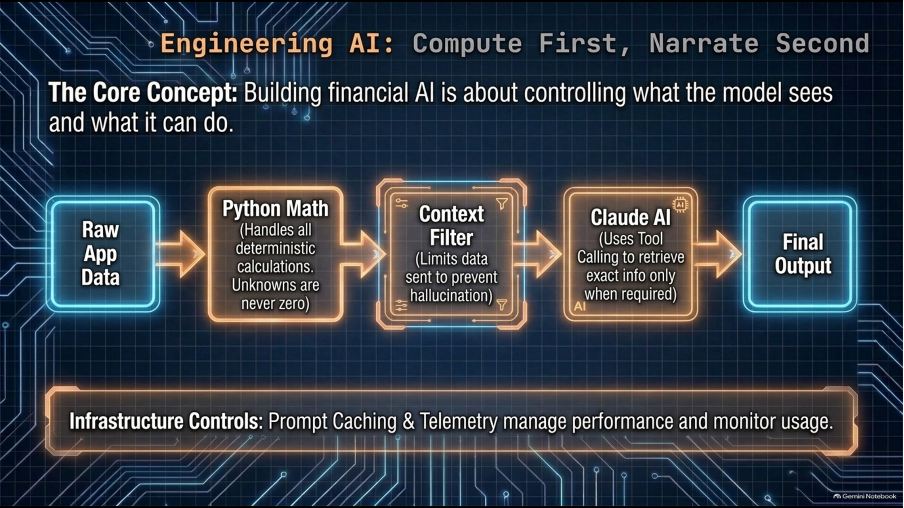
The engineering also controls what the model sees and what it can do:
- Tool calling retrieves information when required.
- Python handles all deterministic calculations.
- Context engineering limits the information sent to the model.
- Prompt caching, model controls and usage telemetry help manage cost and performance.
For example, the Portfolio Review sends the Top 10 equity holdings, with ratings and derived fields already calculated in Python, rather than the entire portfolio. The Financial Review goes further: its complete context is prepared upfront and the model is called once, with no tools.
The principle that emerged was simple:
Compute first. Narrate second.
The impact was measurable. The first Portfolio Review cost about $2.56 per report. After defining the scope, precomputing the context, limiting tools and adding prompt caching, the cost fell to approximately $0.63. The Financial Review, designed this way from the start, costs approximately $0.65 per report. The lesson is that effective AI is not just about getting a good answer. It is about controlling what the model sees, what it can do, and how efficiently it gets there.
Maybe It’s Time to Build Your Own
If you are struggling to get a clear view of your spending and investments, understand your overall financial health, or make sense of your investment decisions, why not build a system that works for you?
And if you need help building one, write to me.